Edit chart
Loading graph
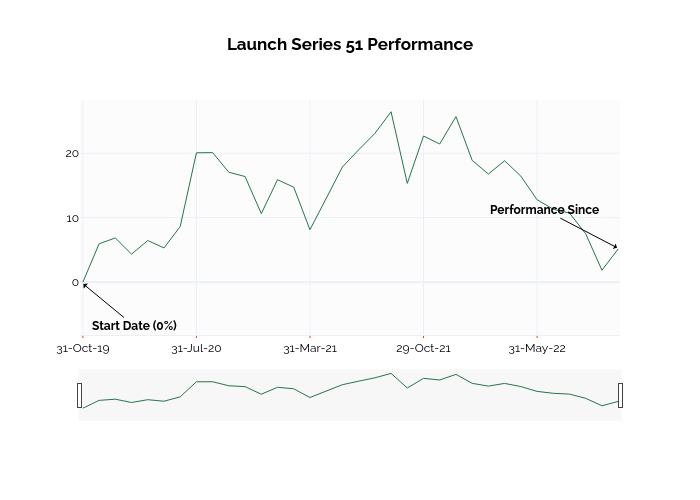
Ssi_plotly's interactive graph and data of "Launch Series 51 Performance" is a line chart; with in the x-axis. The x-axis shows values from -0.05712718599975043 to 33.004081149590554. The y-axis shows values from -8.726253065806684 to 28.259276477147722. This visualization has the following annotations: Start Date (0%); Performance Since