Edit chart
Loading graph
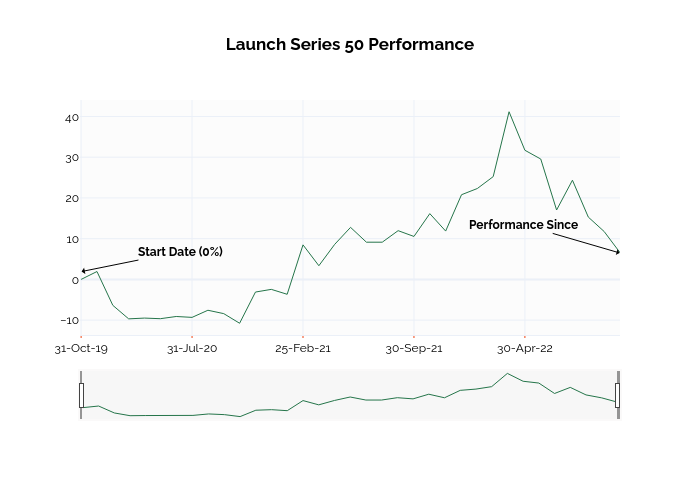
Ssi_plotly's interactive graph and data of "Launch Series 50 Performance" is a line chart; with in the x-axis. The x-axis shows values from -0.07059004232736615 to 34. The y-axis shows values from -13.644444444444444 to 44.04444444444444. This visualization has the following annotations: Start Date (0%); Performance Since