Edit chart
Loading graph
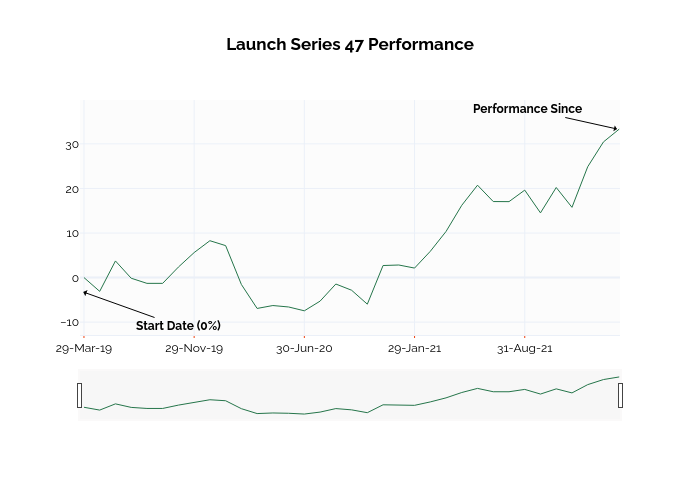
Ssi_plotly's interactive graph and data of "Launch Series 47 Performance" is a line chart; with in the x-axis. The x-axis shows values from -0.12846072037273285 to 34. The y-axis shows values from -9.800381027418847 to 37.00723952095808. This visualization has the following annotations: Start Date (0%); Performance Since