Edit chart
Loading graph
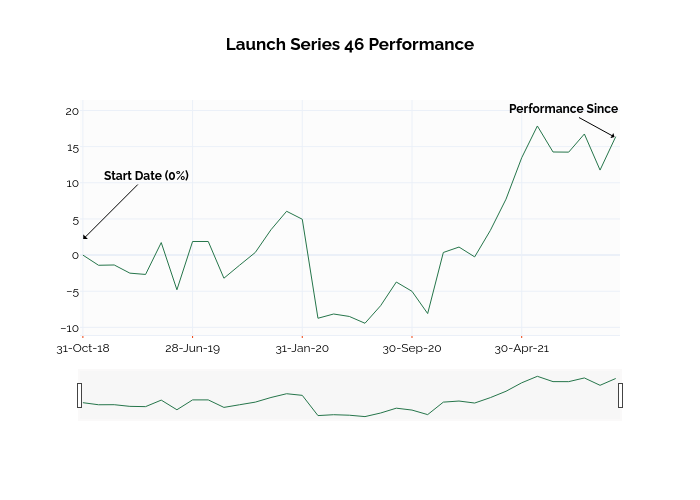
Ssi_plotly's interactive graph and data of "Launch Series 46 Performance" is a line chart; with in the x-axis. The x-axis shows values from -0.14451055753982123 to 34.07807523664732. The y-axis shows values from -11.63402101828716 to 32.44639934745608. This visualization has the following annotations: Start Date (0%); Performance Since