Edit chart
Loading graph
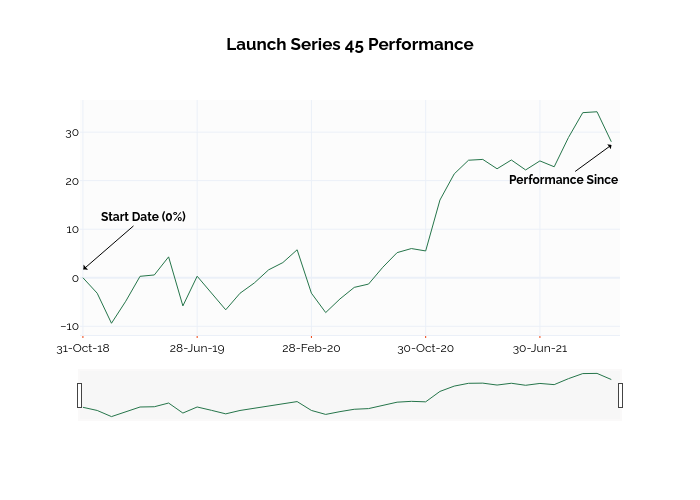
Ssi_plotly's interactive graph and data of "Launch Series 45 Performance" is a line chart; with in the x-axis. The x-axis shows values from -0.16013682905204224 to 37.18296803378771. The y-axis shows values from -11.801111111111112 to 36.62111111111111. This visualization has the following annotations: Start Date (0%); Performance Since