Edit chart
Loading graph
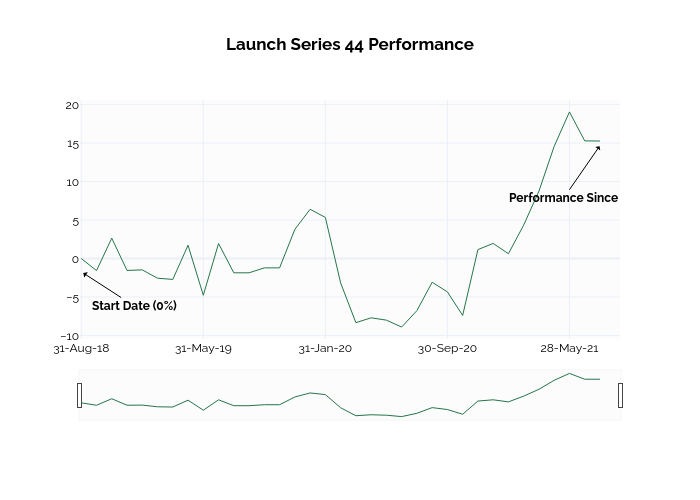
Ssi_plotly's interactive graph and data of "Launch Series 44 Performance" is a line chart. The x-axis shows values from -0.040842529939957795 to 35. The y-axis shows values from -16.181538011927643 to 20.904291474311982. This visualization has the following annotations: Start Date (0%); Performance Since