Edit chart
Loading graph
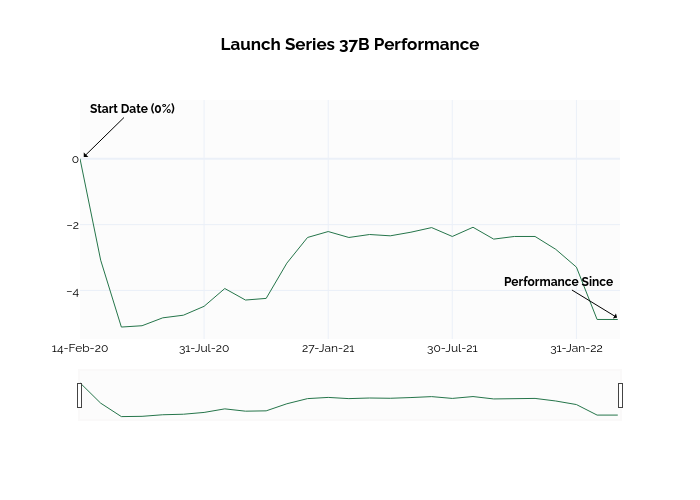
Ssi_plotly's interactive graph and data of "Launch Series 37B Performance" is a line chart. The x-axis shows values from 0 to 26.002148760330577. The y-axis shows values from -5.421500467059168 to 0.8085088741241874. This visualization has the following annotations: Start Date (0%); Performance Since