Edit chart
Loading graph
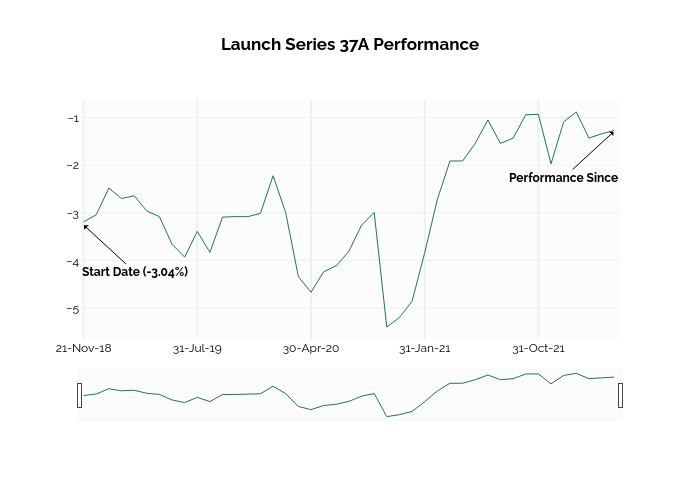
Ssi_plotly's interactive graph and data of "Launch Series 37A Performance" is a line chart. The x-axis shows values from -0.07401278931787372 to 42.04193064217241. The y-axis shows values from -5.651111111111112 to -0.6288888888888888. This visualization has the following annotations: Start Date (-3.04%); Performance Since