Edit chart
Loading graph
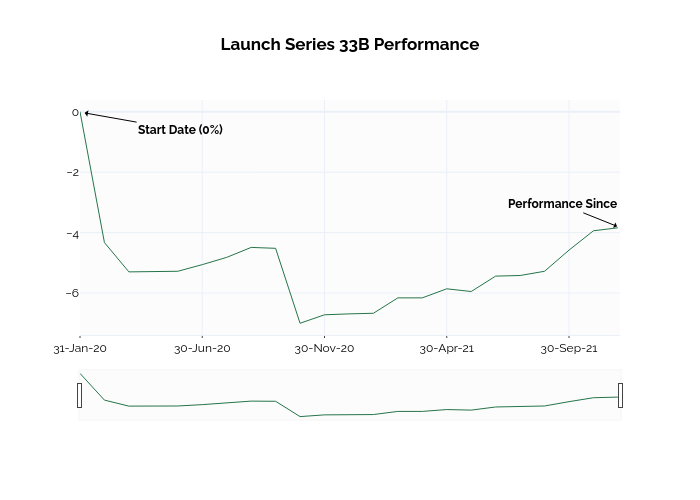
Ssi_plotly's interactive graph and data of "Launch Series 33B Performance" is a line chart. The x-axis shows values from 0 to 22.024173591874423. The y-axis shows values from -7.388888888888889 to 0.38888888888888895. This visualization has the following annotations: Start Date (0%); Performance Since