Edit chart
Loading graph
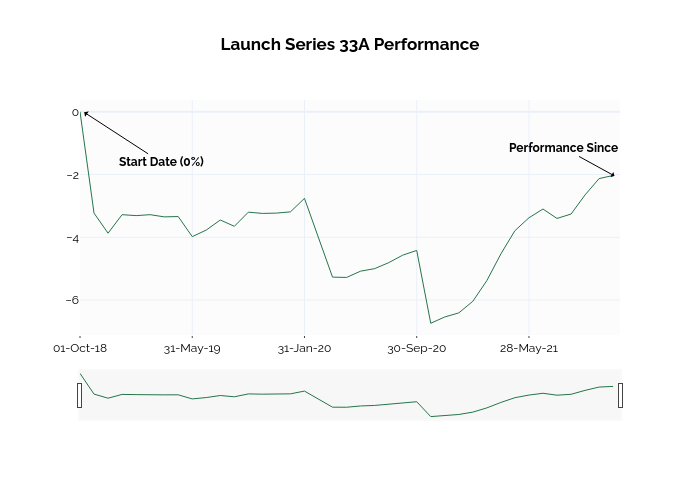
Ssi_plotly's interactive graph and data of "Launch Series 33A Performance" is a scatter chart. The x-axis shows values from 0 to 38.203508771929826. The y-axis shows values from -7.114444444444445 to 0.3744444444444445. This visualization has the following annotations: Start Date (0%); Performance Since