Edit chart
Loading graph
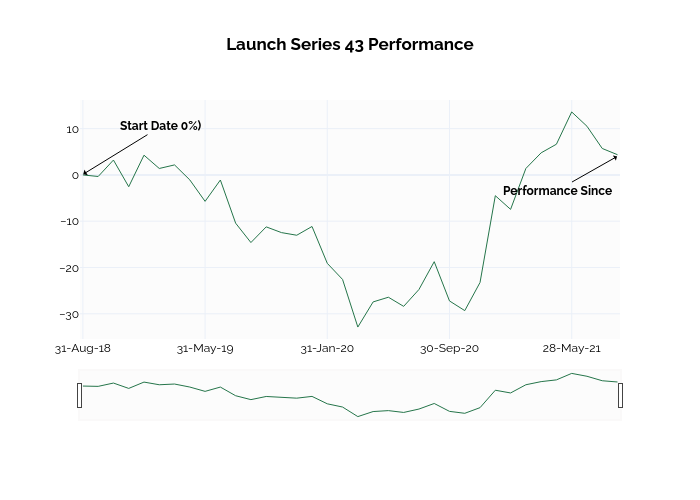
Ssi_plotly's interactive graph and data of "Launch Series 43 Performance" is a line chart. The x-axis shows values from -0.06233045696834368 to 35.04707454171368. The y-axis shows values from -35.44111111111111 to 16.18111111111111. This visualization has the following annotations: Start Date 0%); Performance Since