Edit chart
Loading graph
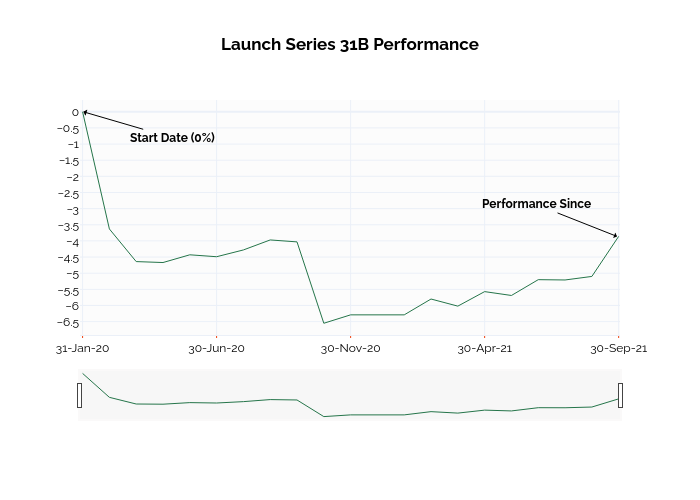
Ssi_plotly's interactive graph and data of "Launch Series 31B Performance" is a line chart. The x-axis shows values from -0.034064038484348864 to 20. The y-axis shows values from -6.913888888888889 to 0.363888888888889. This visualization has the following annotations: Start Date (0%); Performance Since