Edit chart
Loading graph
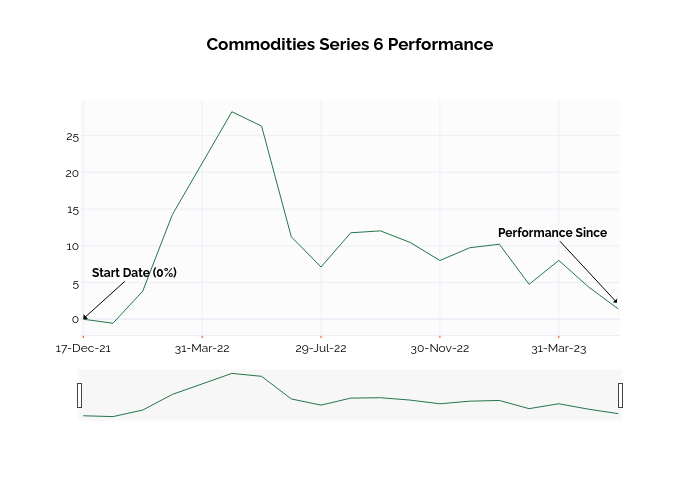
Ssi_plotly's interactive graph and data of "Commodities Series 6 Performance" is a line chart; with in the x-axis. The x-axis shows values from -0.028589601405808275 to 18. The y-axis shows values from -2.15 to 29.85. This visualization has the following annotations: Start Date (0%); Performance Since