Edit chart
Loading graph
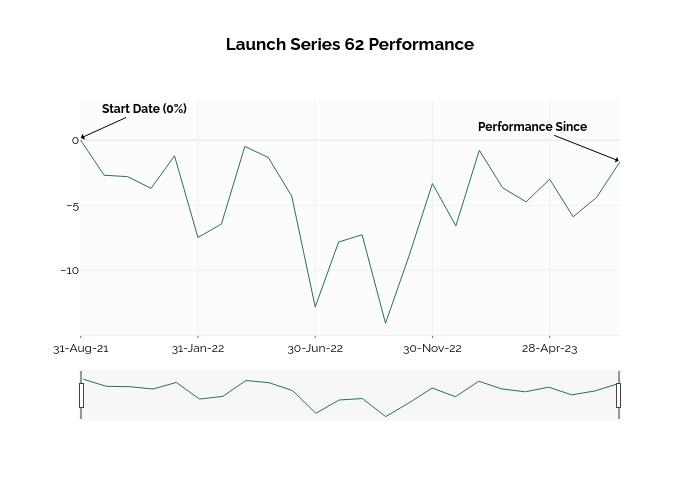
Ssi_plotly's interactive graph and data of "Launch Series 62 Performance" is a line chart; with in the x-axis. The x-axis shows values from -0.031035669043402256 to 23. The y-axis shows values from -15.001731794295331 to 3.4329040916112947. This visualization has the following annotations: Start Date (0%); Performance Since