Edit chart
Loading graph
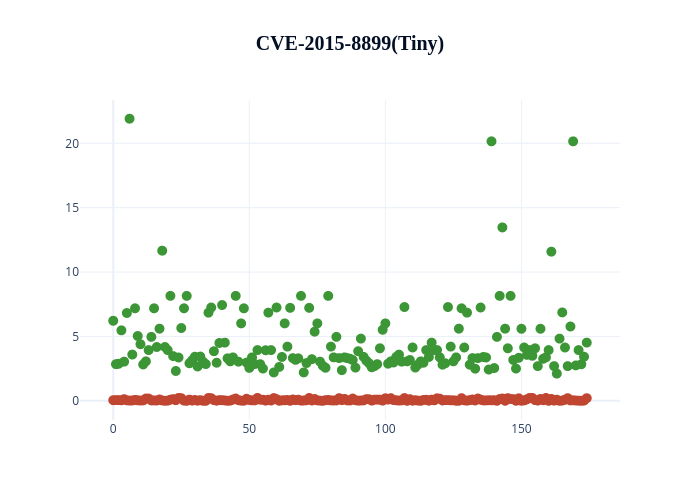
Sqjdxll's interactive graph and data of "CVE-2015-8899(Tiny)" is a scatter chart, showing Patched vs Vul. The x-axis shows values from -11.284031588810068 to 185.28403158881008. The y-axis shows values from -1.4885004461678457 to 23.362614488454533.