Edit chart
Loading graph
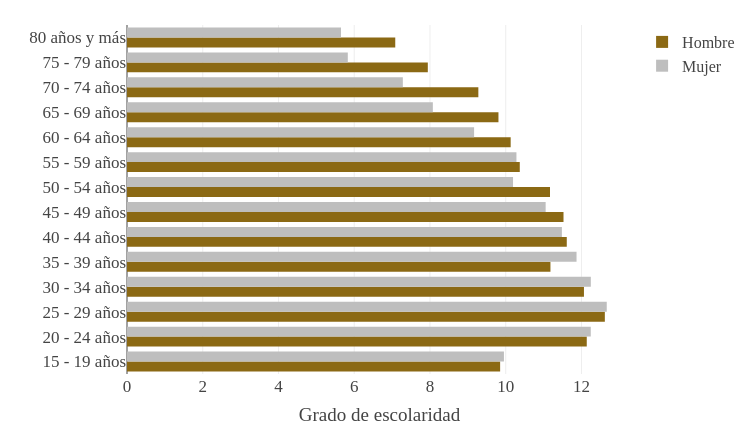
Sigem's interactive graph and data is a bar chart; with Grado de escolaridad in the x-axis. The x-axis shows values from 0 to 13.334274022858738. The y-axis shows values from 2.5 to 16.5.