Edit chart
Loading graph
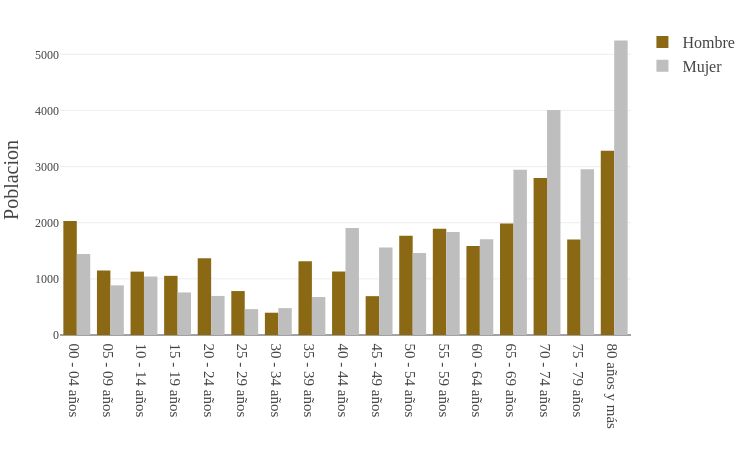
Sigem's interactive graph and data of "Poblacion vs " is a bar chart; with in the x-axis and Poblacion in the y-axis.. The x-axis shows values from -0.5 to 16.5. The y-axis shows values from 0 to 5522.105263157895.