Edit chart
Loading graph
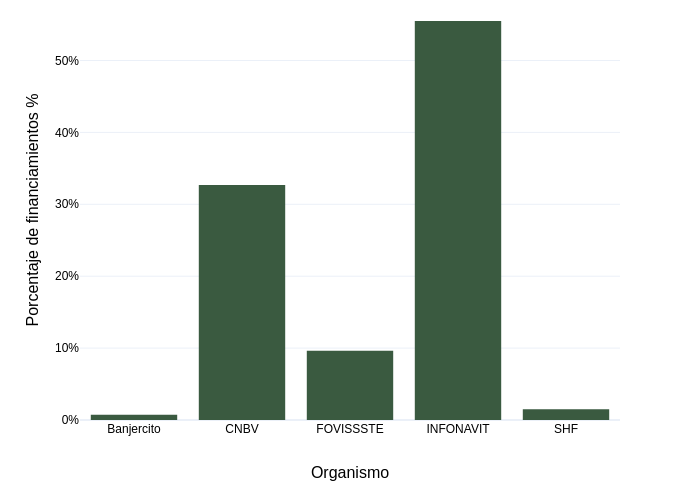
Sigem's interactive graph and data of "Porcentaje de financiamientos % vs Organismo" is a bar chart; with Organismo in the x-axis and Porcentaje de financiamientos % in the y-axis.. The x-axis shows values from -0.5 to 4.5. The y-axis shows values from 0 to 58.410526315789475.