Edit chart
Loading graph
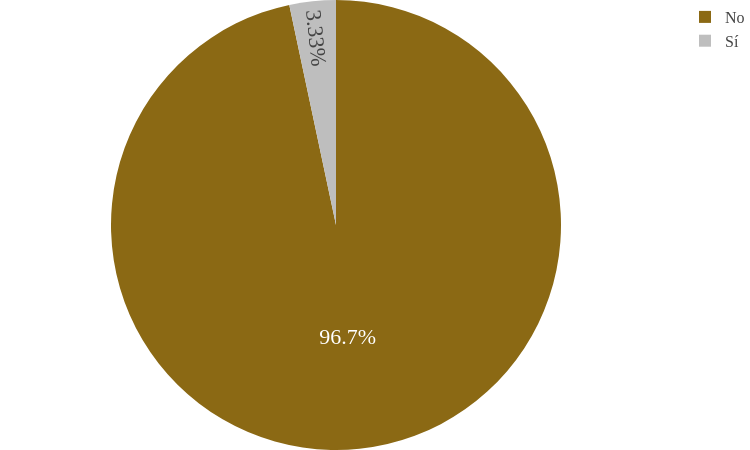
Sigem's interactive graph and data of "{'x': 0.05, 'font': {'size': 30, 'family': 'Times New Roman'}}" is a pie. The x-axis shows values from 0 to 0. The y-axis shows values from 0 to 0.