Edit chart
Loading graph
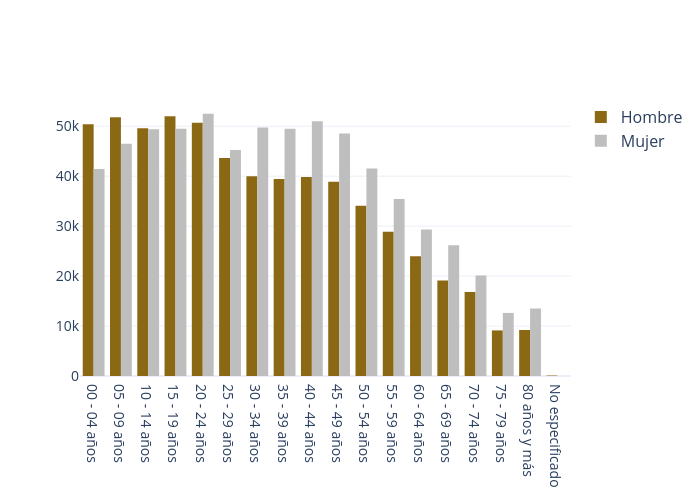
Sigem's interactive graph and data is a bar chart; with {'font': {'size': 14}} in the x-axis. The x-axis shows values from -0.5 to 17.5. The y-axis shows values from 0 to 55248.42105263158.