Edit chart
Loading graph
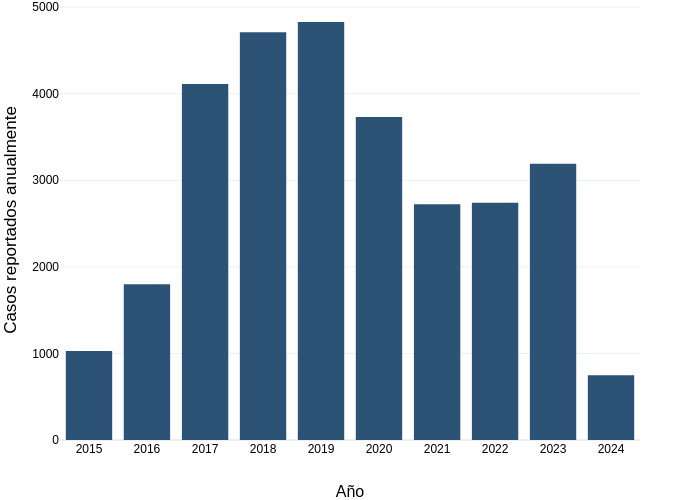
Sigem's interactive graph and data of "" is a bar chart, showing Casos reportados anualmente; with Año in the x-axis and Casos reportados anualmente in the y-axis.. The x-axis shows values from 3.3041672717243964 to 3.3061032087275852. The y-axis shows values from 0 to 5082.105263157895.