Edit chart
Loading graph
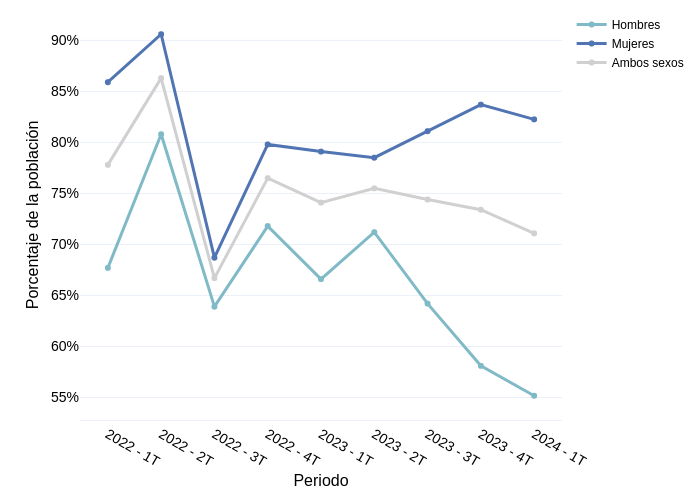
Sigem's interactive graph and data of "" is a , showing Hombres, Mujeres, Ambos sexos; with Periodo in the x-axis and Porcentaje de la población in the y-axis.. The x-axis shows values from -0.5342465753424657 to 9.534246575342465. The y-axis shows values from 52.903795399515744 to 92.86620460048425.