Edit chart
Loading graph
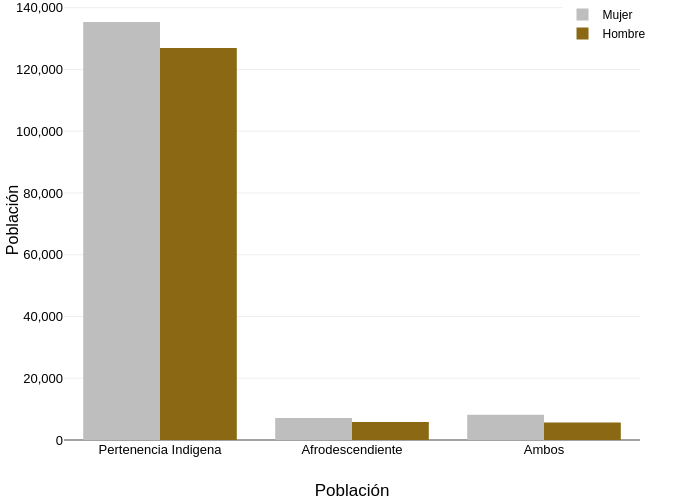
Sigem's interactive graph and data of "" is a bar chart; with Población in the x-axis and Población in the y-axis.. The x-axis shows values from -0.5 to 2.5. The y-axis shows values from 0 to 142491.57894736843.