Edit chart
Loading graph
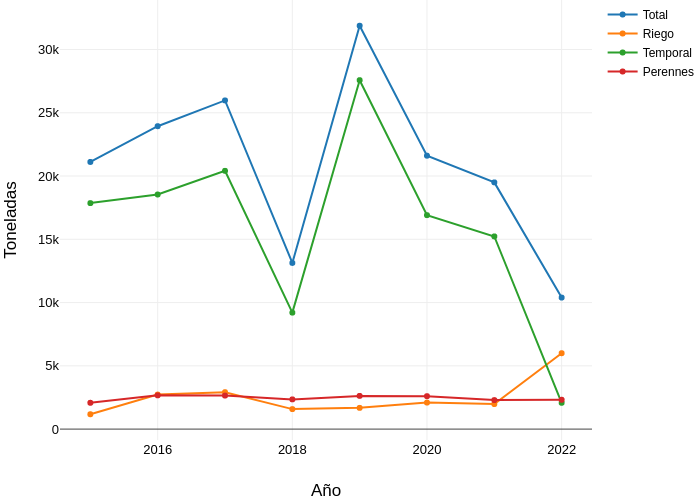
Sigem's interactive graph and data of "Toneladas vs Año" is a line chart, showing Total, Riego, Temporal, Perennes; with Año in the x-axis and Toneladas in the y-axis.. The x-axis shows values from 2014.5260596407397 to 2023.4739403592603. The y-axis shows values from -998.6698832968636 to 34049.09988329686.