Edit chart
Loading graph
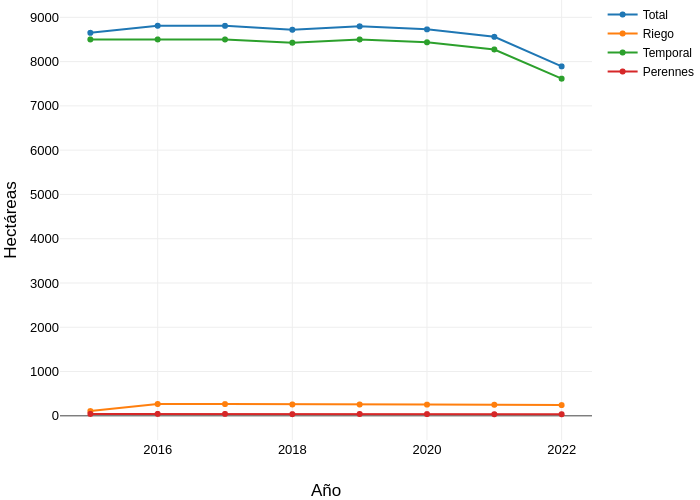
Sigem's interactive graph and data of "Hectáreas vs Año" is a line chart, showing Total, Riego, Temporal, Perennes; with Año in the x-axis and Hectáreas in the y-axis.. The x-axis shows values from 2014.5260596407397 to 2023.4739403592603. The y-axis shows values from -568.0057763199001 to 9411.8257763199.