Edit chart
Loading graph
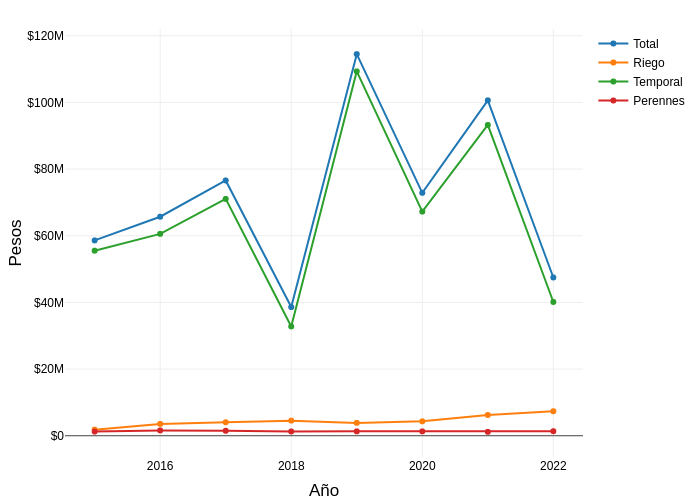
Sigem's interactive graph and data of "Pesos vs Año" is a line chart, showing Total, Riego, Temporal, Perennes; with Año in the x-axis and Pesos in the y-axis.. The x-axis shows values from 2014.5260596407397 to 2023.4739403592603. The y-axis shows values from -6510141.179945857 to 122145563.02994585.