Edit chart
Loading graph
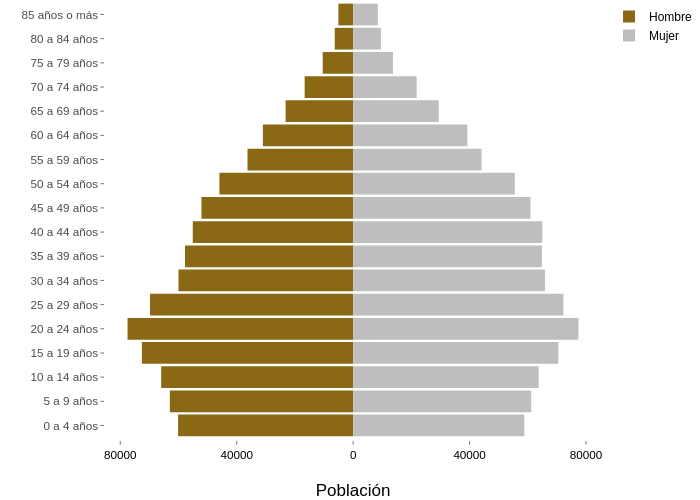
Sigem's interactive graph and data of "" is a , showing Hombre vs Mujer; with Población in the x-axis and Rango de edad in the y-axis.. The x-axis shows values from -85254 to 85136. The y-axis shows values from 0.4 to 18.6.