Edit chart
Loading graph
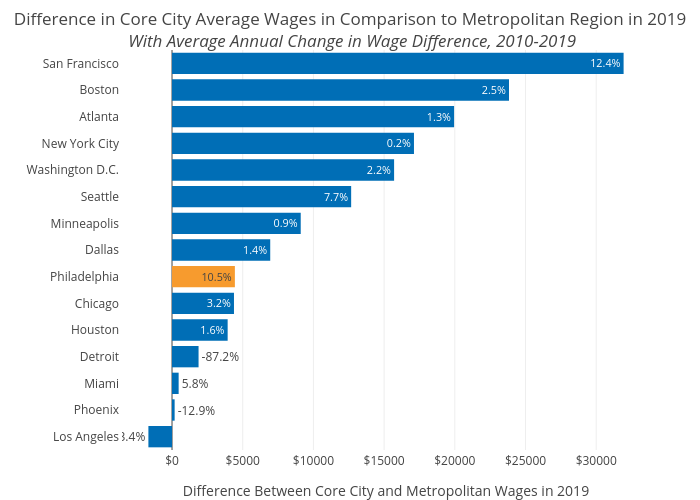
Shausnerlevine's interactive graph and data of "Difference in Core City Average Wages in Comparison to Metropolitan Region in 2019 With Average Annual Change in Wage Difference, 2010-2019" is a bar chart; with Difference Between Core City and Metropolitan Wages in 2019 in the x-axis. The x-axis shows values from 0 to 0. The y-axis shows values from 0 to 0.