Edit chart
Loading graph
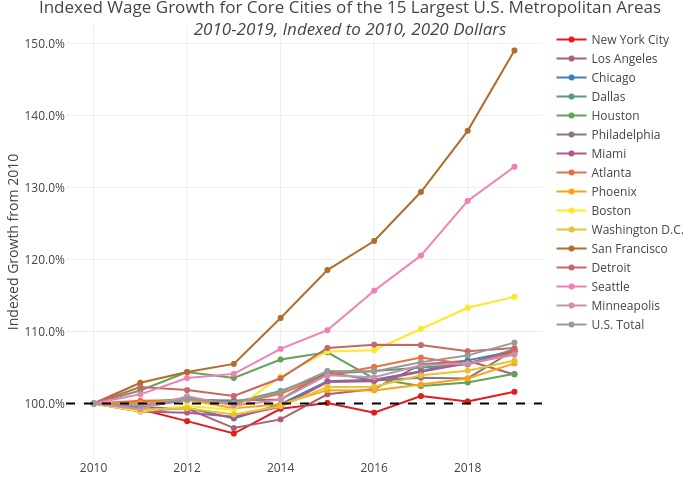
Shausnerlevine's interactive graph and data of "Indexed Wage Growth for Core Cities of the 15 Largest U.S. Metropolitan Areas2010-2019, Indexed to 2010, 2020 Dollars" is a line chart, showing New York City, Los Angeles, Chicago, Dallas, Houston, Philadelphia, Miami, Atlanta, Phoenix, Boston, Washington D.C., San Francisco, Detroit, Seattle, Minneapolis, U.S. Total; with Indexed Growth from 2010 in the y-axis. The x-axis shows values from 0 to 0. The y-axis shows values from 0 to 0.