Edit chart
Loading graph
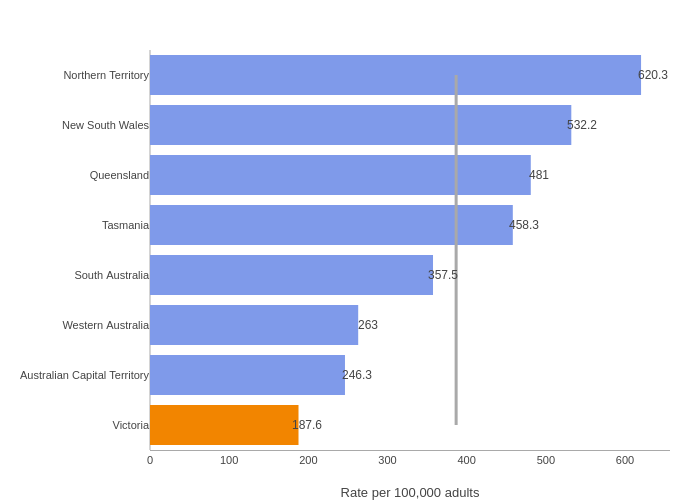
Sac's interactive graph and data of " " is a bar chart; with Rate per 100,000 adults in the x-axis. The x-axis shows values from 0 to 652.9473684210526. The y-axis shows values from -0.5 to 7.5. This visualization has the following annotations: 246.3; 532.2; 620.3; 481; 357.5; 458.3; 187.6; 263