Edit chart
Loading graph
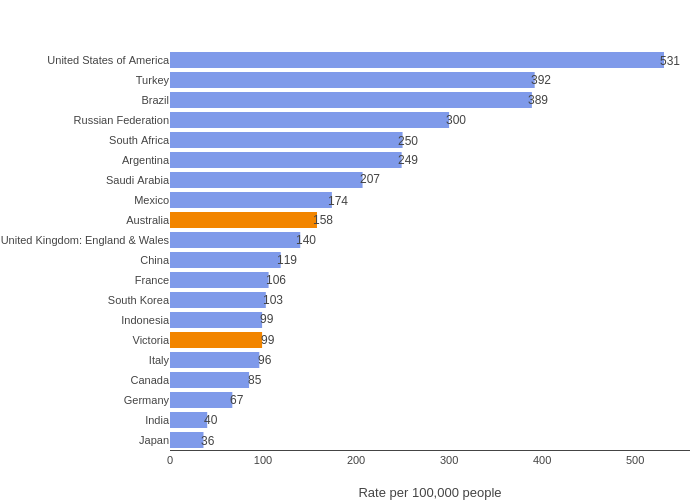
Sac's interactive graph and data of " " is a bar chart; with Rate per 100,000 people in the x-axis. The x-axis shows values from 0 to 558.9473684210526. The y-axis shows values from -0.5 to 19.5. This visualization has the following annotations: 531; 392; 389; 300; 250; 249; 207; 174; 158; 140; 119; 106; 103; 99; 99; 96; 85; 67; 40; 36