Edit chart
Loading graph
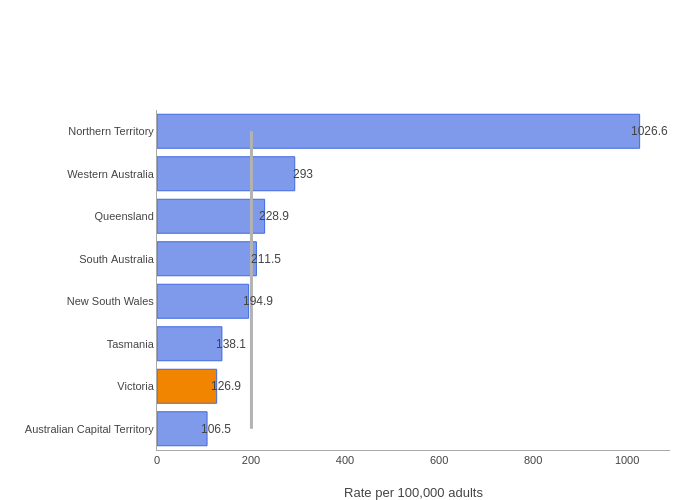
Sac's interactive graph and data of " " is a bar chart; with Rate per 100,000 adults in the x-axis and in the y-axis.. The x-axis shows values from 0 to 1080.6315789473683. The y-axis shows values from -0.5 to 7.5. This visualization has the following annotations: 1026.6; 293; 228.9; 211.5; 194.9; 138.1; 126.9; 106.5