Edit chart
Loading graph
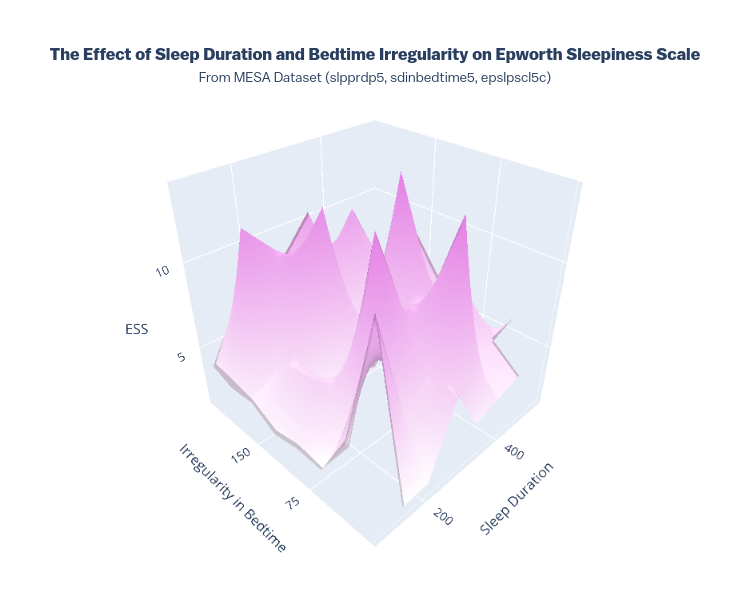
Ryan_waterloo's interactive graph and data of "The Effect of Sleep Duration and Bedtime Irregularity on Epworth Sleepiness ScaleFrom MESA Dataset (slpprdp5, sdinbedtime5, epslpscl5c)" is a surface. The x-axis shows values from 0 to 0. The y-axis shows values from 0 to 0.