Edit chart
Loading graph
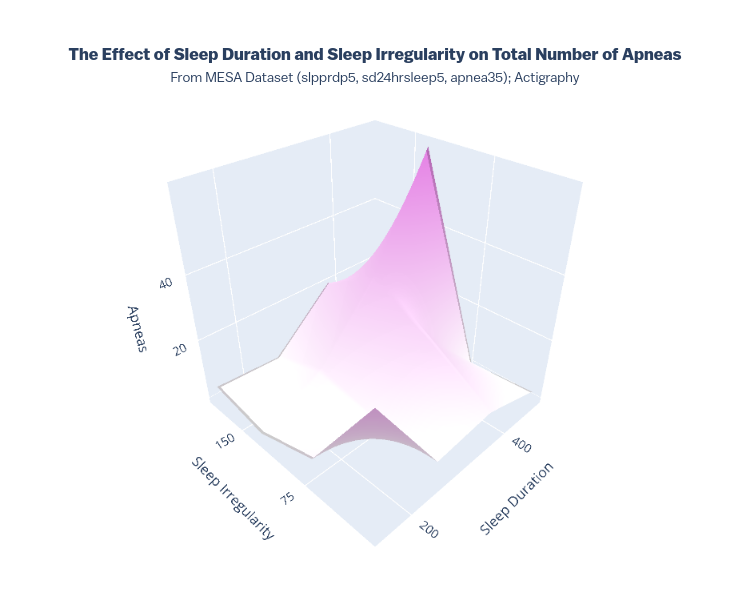
Ryan_waterloo's interactive graph and data of "The Effect of Sleep Duration and Sleep Irregularity on Total Number of ApneasFrom MESA Dataset (slpprdp5, sd24hrsleep5, apnea35); Actigraphy" is a surface. The x-axis shows values from 0 to 0. The y-axis shows values from 0 to 0.