Edit chart
Loading graph
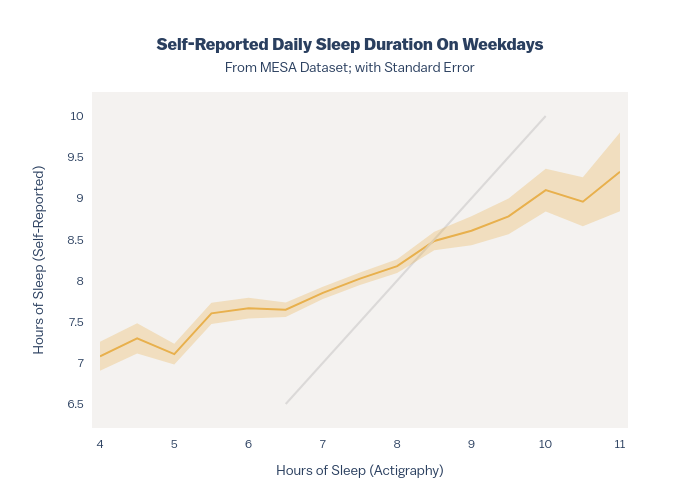
Ryan_waterloo's interactive graph and data of "Self-Reported Daily Sleep Duration On WeekdaysFrom MESA Dataset; with Standard Error" is a line chart, showing Average Value, X = Y Line, Upper Standard Error, Lower Standard Error; with Hours of Sleep (Actigraphy) in the x-axis and Hours of Sleep (Self-Reported) in the y-axis.. The x-axis shows values from 0 to 0. The y-axis shows values from 0 to 0.