Edit chart
Loading graph
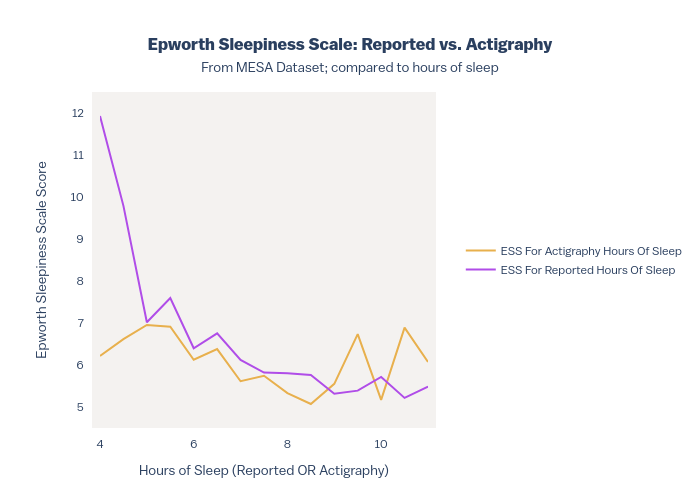
Ryan_waterloo's interactive graph and data of "Epworth Sleepiness Scale: Reported vs. ActigraphyFrom MESA Dataset; compared to hours of sleep" is a line chart, showing ESS For Actigraphy Hours Of Sleep vs ESS For Reported Hours Of Sleep; with Hours of Sleep (Reported OR Actigraphy) in the x-axis and Epworth Sleepiness Scale Score in the y-axis.. The x-axis shows values from 0 to 0. The y-axis shows values from 0 to 0.