Edit chart
Loading graph
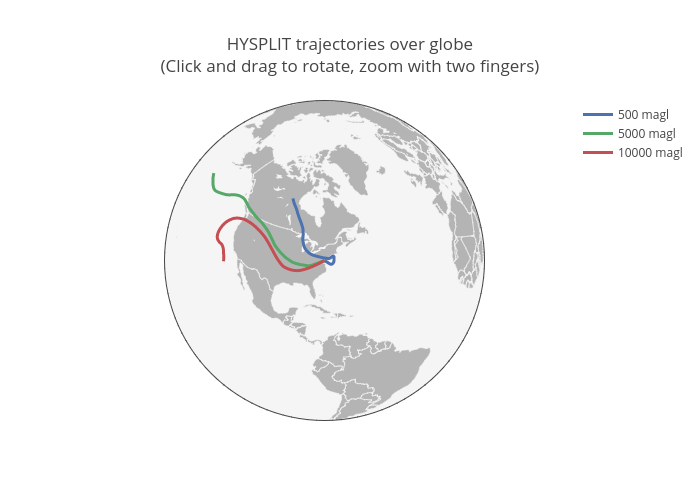
Rolandoos's interactive graph and data of "HYSPLIT trajectories over globe(Click and drag to rotate, zoom with two fingers)" is a scattergeo, showing 500 magl, 5000 magl, 10000 magl. The x-axis shows values from 0 to 0. The y-axis shows values from 0 to 0.