Edit chart
Loading graph
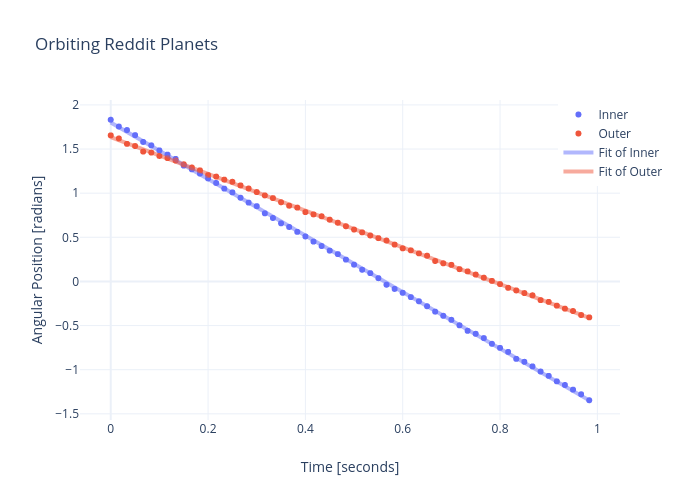
Rhettallain's interactive graph and data of "Orbiting Reddit Planets" is a scatter chart, showing Inner vs Outer; with Time [seconds] in the x-axis and Angular Position [radians] in the y-axis.. The x-axis shows values from -0.060259228725840476 to 1.0435925620591744. The y-axis shows values from -1.5825380992598372 to 2.0684678022598373.