Edit chart
Loading graph
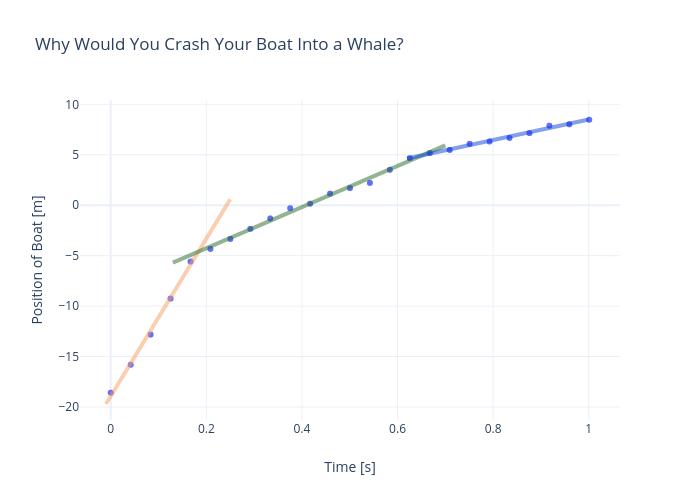
Rhettallain's interactive graph and data of "Why Would You Crash Your Boat Into a Whale?" is a scatter chart; with Time [s] in the x-axis and Position of Boat [m] in the y-axis.. The x-axis shows values from -0.06132771381578945 to 1.062327713815789. The y-axis shows values from -21.29283551803349 to 10.486855732932684.