Edit chart
Loading graph
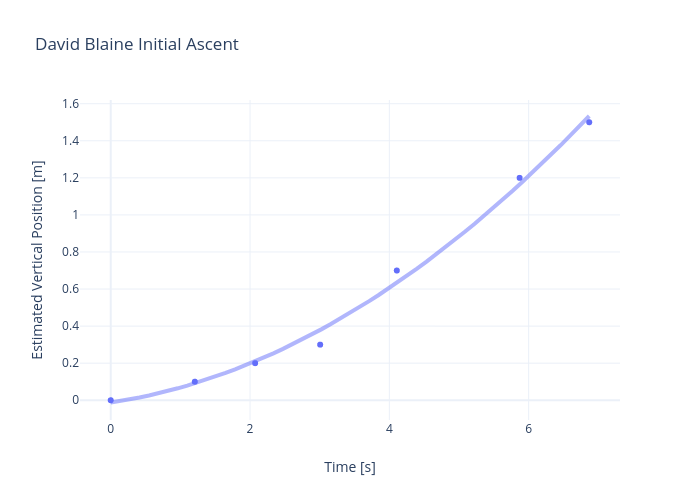
Rhettallain's interactive graph and data of "David Blaine Initial Ascent" is a scatter chart; with Time [s] in the x-axis and Estimated Vertical Position [m] in the y-axis.. The x-axis shows values from -0.4218421052631579 to 7.291842105263158. The y-axis shows values from -0.11157451668982904 to 1.6203284289433382.