Edit chart
Loading graph
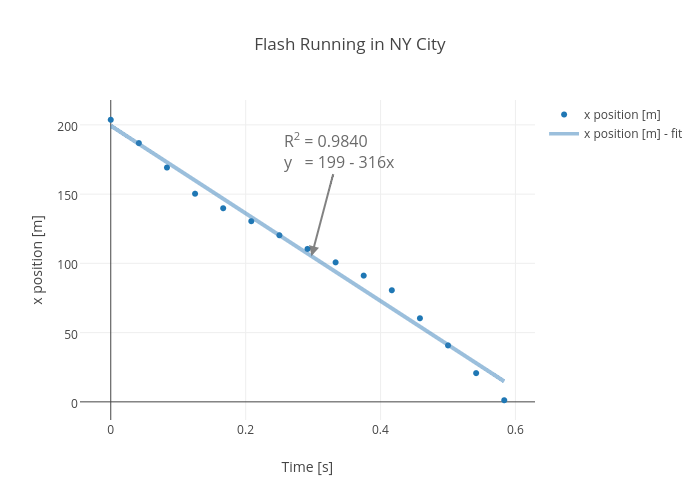
Rhettallain's interactive graph and data of "Flash Running in NY City" is a scatter chart, showing x position [m] vs x position [m] - fit; with Time [s] in the x-axis and x position [m] in the y-axis.. The x-axis shows values from -0.03472905058450666 to 0.6180623839178206. The y-axis shows values from -11.644787586738268 to 216.49049976832774. This visualization has the following annotation: R2 = 0.9840y = 199 - 316x