Edit chart
Loading graph
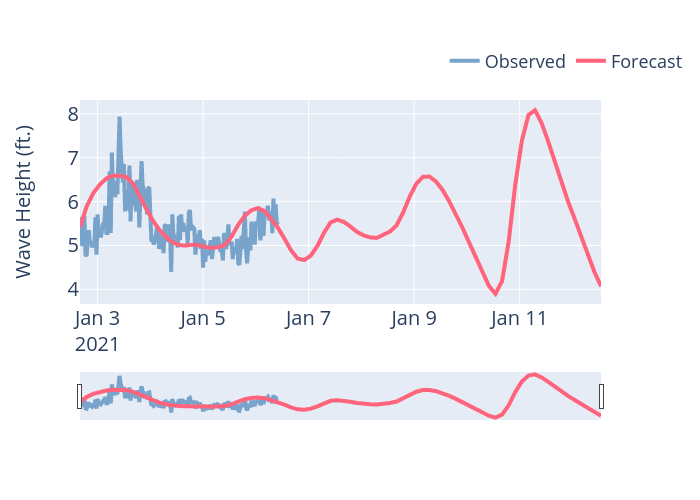
Ribplotly's interactive graph and data of "Wave Height (ft.) vs {'font': {'size': 20}}" is a scatter chart, showing Observed vs Forecast; with {'font': {'size': 20}} in the x-axis and Wave Height (ft.) in the y-axis.. The x-axis shows values from 0 to 0. The y-axis shows values from 0 to 0.