Edit chart
Loading graph
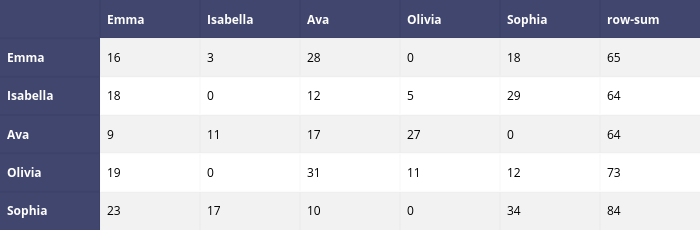
Pythonplotbot's interactive graph and data is a heatmap. The x-axis shows values from 0 to 0. The y-axis shows values from 0 to 0. This visualization has the following annotations: ; Emma; Isabella; Ava; Olivia; Sophia; row-sum; Emma; 16; 3; 28; 0; 18; 65; Isabella; 18; 0; 12; 5; 29; 64; Ava; 9; 11; 17; 27; 0; 64; Olivia; 19; 0; 31; 11; 12; 73; Sophia; 23; 17; 10; 0; 34; 84