Edit chart
Loading graph
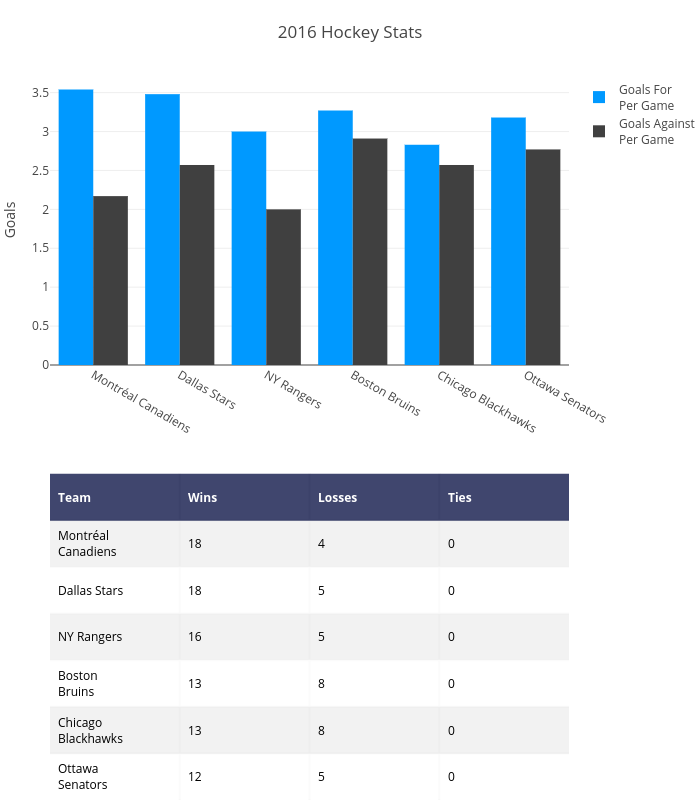
Pythonplotbot's interactive graph and data of "2016 Hockey Stats" is a heatmap, showing Goals ForPer Game vs Goals AgainstPer Game. The x-axis shows values from 0 to 0. The y-axis shows values from 0 to 0. This visualization has the following annotations: Team; Wins; Losses; Ties; MontréalCanadiens; 18; 4; 0; Dallas Stars; 18; 5; 0; NY Rangers; 16; 5; 0; BostonBruins; 13; 8; 0; ChicagoBlackhawks; 13; 8; 0; OttawaSenators; 12; 5; 0