Edit chart
Loading graph
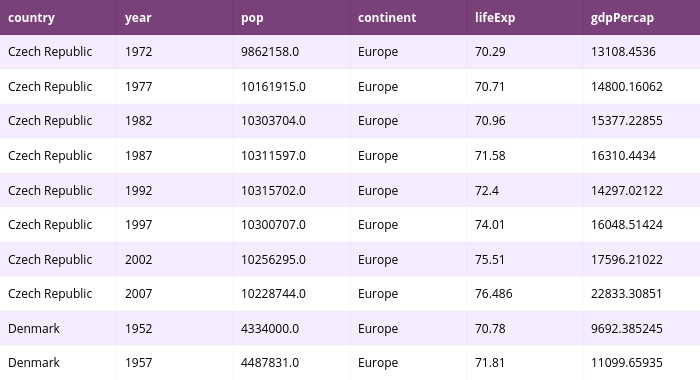
Pythonplotbot's interactive graph and data is a heatmap. The x-axis shows values from 0 to 0. The y-axis shows values from 0 to 0. This visualization has the following annotations: country; year; pop; continent; lifeExp; gdpPercap; Czech Republic; 1972; 9862158.0; Europe; 70.29; 13108.4536; Czech Republic; 1977; 10161915.0; Europe; 70.71; 14800.16062; Czech Republic; 1982; 10303704.0; Europe; 70.96; 15377.22855; Czech Republic; 1987; 10311597.0; Europe; 71.58; 16310.4434; Czech Republic; 1992; 10315702.0; Europe; 72.4; 14297.02122; Czech Republic; 1997; 10300707.0; Europe; 74.01; 16048.51424; Czech Republic; 2002; 10256295.0; Europe; 75.51; 17596.21022; Czech Republic; 2007; 10228744.0; Europe; 76.486; 22833.30851; Denmark; 1952; 4334000.0; Europe; 70.78; 9692.385245; Denmark; 1957; 4487831.0; Europe; 71.81; 11099.65935