Edit chart
Loading graph
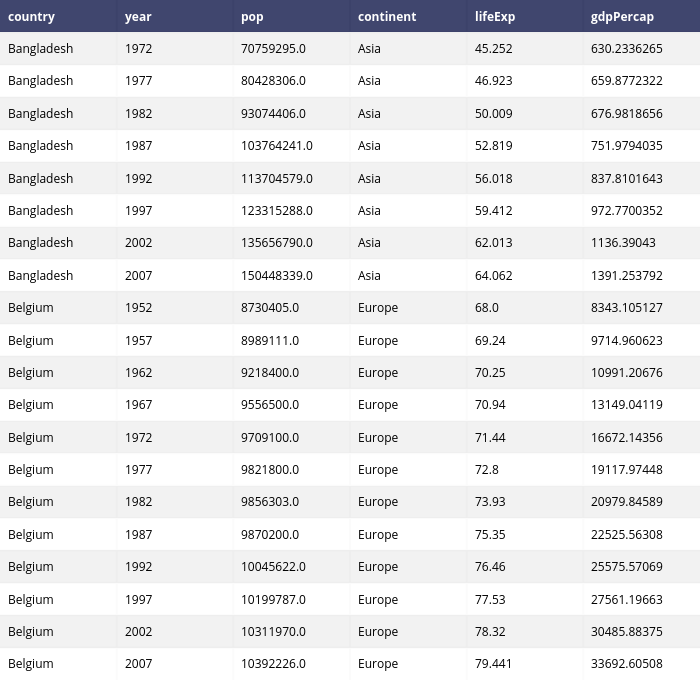
Pythonplotbot's interactive graph and data is a heatmap. The x-axis shows values from 0 to 0. The y-axis shows values from 0 to 0. This visualization has the following annotations: country; year; pop; continent; lifeExp; gdpPercap; Bangladesh; 1972; 70759295.0; Asia; 45.252; 630.2336265; Bangladesh; 1977; 80428306.0; Asia; 46.923; 659.8772322; Bangladesh; 1982; 93074406.0; Asia; 50.009; 676.9818656; Bangladesh; 1987; 103764241.0; Asia; 52.819; 751.9794035; Bangladesh; 1992; 113704579.0; Asia; 56.018; 837.8101643; Bangladesh; 1997; 123315288.0; Asia; 59.412; 972.7700352; Bangladesh; 2002; 135656790.0; Asia; 62.013; 1136.39043; Bangladesh; 2007; 150448339.0; Asia; 64.062; 1391.253792; Belgium; 1952; 8730405.0; Europe; 68.0; 8343.105127; Belgium; 1957; 8989111.0; Europe; 69.24; 9714.960623; Belgium; 1962; 9218400.0; Europe; 70.25; 10991.20676; Belgium; 1967; 9556500.0; Europe; 70.94; 13149.04119; Belgium; 1972; 9709100.0; Europe; 71.44; 16672.14356; Belgium; 1977; 9821800.0; Europe; 72.8; 19117.97448; Belgium; 1982; 9856303.0; Europe; 73.93; 20979.84589; Belgium; 1987; 9870200.0; Europe; 75.35; 22525.56308; Belgium; 1992; 10045622.0; Europe; 76.46; 25575.57069; Belgium; 1997; 10199787.0; Europe; 77.53; 27561.19663; Belgium; 2002; 10311970.0; Europe; 78.32; 30485.88375; Belgium; 2007; 10392226.0; Europe; 79.441; 33692.60508