Edit chart
Loading graph
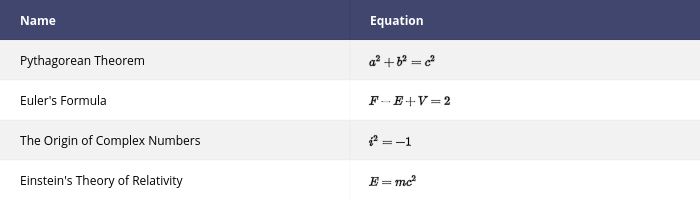
Pythonplotbot's interactive graph and data is a heatmap. The x-axis shows values from 0 to 0. The y-axis shows values from 0 to 0. This visualization has the following annotations: Name; Equation; Pythagorean Theorem; $a^{2}+b^{2}=c^{2}$; Euler's Formula; $F-E+V=2$; The Origin of Complex Numbers; $i^{2}=-1$; Einstein's Theory of Relativity; $E=m c^{2}$