Edit chart
Loading graph
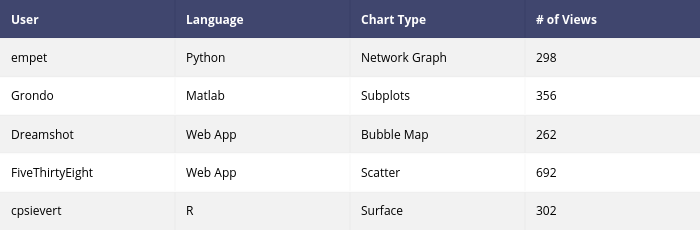
Pythonplotbot's interactive graph and data is a heatmap. The x-axis shows values from 0 to 0. The y-axis shows values from 0 to 0. This visualization has the following annotations: User; Language; Chart Type; # of Views; empet; Python; Network Graph; 298; Grondo; Matlab; Subplots; 356; Dreamshot; Web App; Bubble Map; 262; FiveThirtyEight; Web App; Scatter; 692; cpsievert; R; Surface; 302