Edit chart
Loading graph
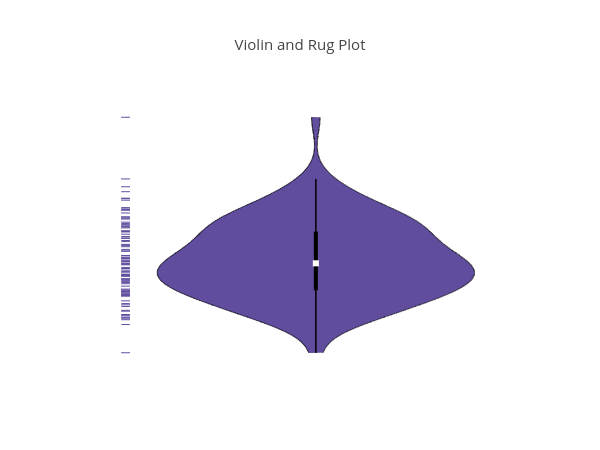
Pythonplotbot's interactive graph and data of "Violin and Rug Plot" is a filled line chart, showing , , , . The x-axis shows values from -0.5174639647441373 to 0.447886637286781. The y-axis shows values from 0 to 0.