Edit chart
Loading graph
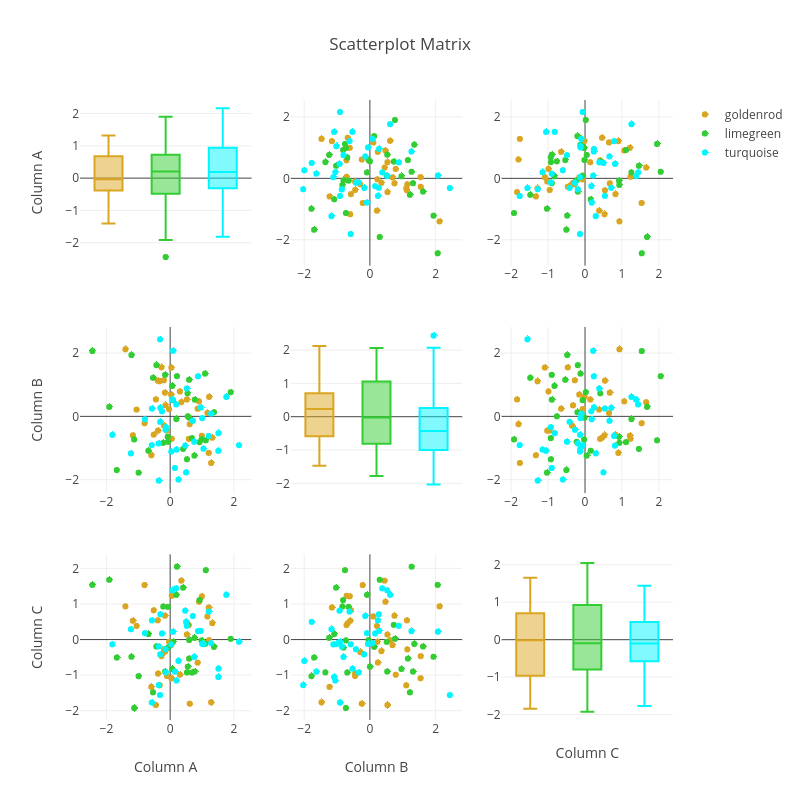
Pythonplotbot's interactive graph and data of "Scatterplot Matrix" is a box plot, showing None, None, None, goldenrod, limegreen, turquoise, goldenrod, limegreen, turquoise, goldenrod, limegreen, turquoise, None, None, None, goldenrod, limegreen, turquoise, goldenrod, limegreen, turquoise, goldenrod, limegreen, turquoise, None, None, None. The x-axis shows values from 0 to 0. The y-axis shows values from 0 to 0.